Dans le cadre de mes cours, je suis amené à introduire les angles d’Euler aux étudiants. Du coup je n’ai pas résisté à la tentation d’illustrer ça sous TikZ, et je me dis que ça peut servir pour mes collègues mécaniciens ou métallurgistes.
Version « statique »
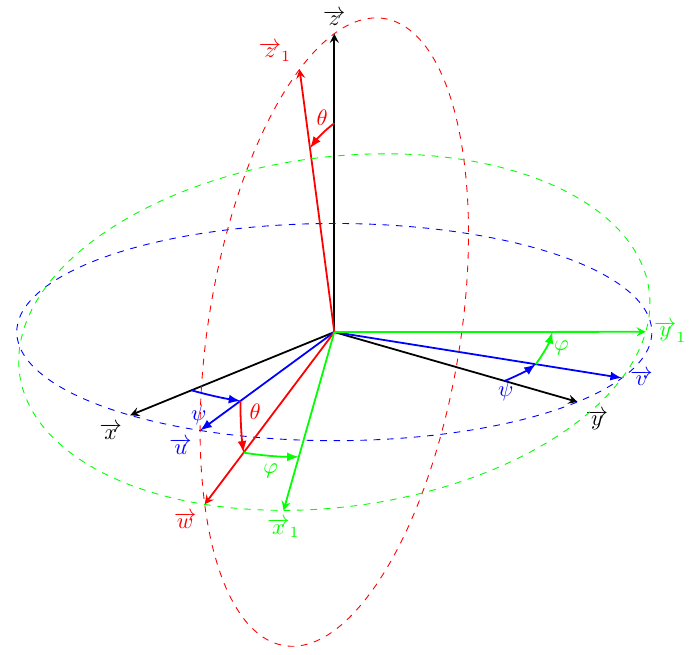
Le tout est basé sur l’excellent package tikz-3dplot, maintenu par Jeffrey Hein. Voici donc le résultat escompté :
Note : La convention utilisée ici est z-y-z. Pour représenter la convention z-x-z, il va falloir mettre un peu les mains dans le cambouis…
Et ici le code associé :
\usepackage{tikz} \usepackage{tikz-3dplot} \begin{document} \tdplotsetmaincoords{70}{130} \begin{tikzpicture}[tdplot_main_coords,scale=5] %% Définition des différents styles \tikzstyle{init} = [black] % base initiale \tikzstyle{prec} = [blue] % 1ere base intermédiaire \tikzstyle{nuta} = [red] % 2eme base initiale \tikzstyle{rotp} = [green] % base finale \tikzstyle{base} = [thick,-stealth] % Tracé des bases \tikzstyle{angle} = [thick,-latex] % Tracé des arcs pour les angles \tikzstyle{circle} = [thin,dashed] % Tracé des cercles %% Paramètres géométriques \def\epsi{15} % Angle de precession dessiné \def\etheta{15} % Angle de nutation dessiné \def\ephi{15} % Angle de rotation propre dessiné \def\rang{0.7} % Rayon utilisé pour tracer les angles %% Tracé % Repère initial \coordinate (O) at (0,0,0); \draw[base,init] (O) -- (1,0,0) node[anchor=north east]{$\overrightarrow{x}$}; \draw[base,init] (O) -- (0,1,0) node[anchor=north west]{$\overrightarrow{y}$}; \draw[base,init] (O) -- (0,0,1) node[anchor=south]{$\overrightarrow{z}$}; % Précession \tdplotsetrotatedcoords{\epsi}{0}{0} \draw[tdplot_rotated_coords,angle,prec] (O) --(1,0,0) node[anchor=north east]{$\overrightarrow{u}$}; \draw[tdplot_rotated_coords,angle,prec] (O) --(0,1,0) node[anchor=west]{$\overrightarrow{v}$}; \tdplotdrawarc[tdplot_rotated_coords,circle,prec]{(0,0,0)}{1}{0}{360}{}{} \tdplotdrawarc[tdplot_rotated_coords,angle,prec]{(0,0,0)}{\rang}{90-\epsi}{90}{anchor=north east,prec}{$\psi$} \tdplotdrawarc[tdplot_rotated_coords,angle,prec]{(0,0,0)}{\rang}{-\epsi}{0}{anchor=north east,prec}{$\psi$} % Nutation \tdplotsetrotatedcoords{\epsi}{\etheta}{0} \draw[tdplot_rotated_coords,base,nuta] (O) --(1,0,0) node[anchor=north east]{$\overrightarrow{w}$}; \draw[tdplot_rotated_coords,base,nuta] (O) --(0,0,1) node[anchor=south east]{$\overrightarrow{z}_1$}; \tdplotsetrotatedthetaplanecoords{0} \tdplotdrawarc[tdplot_rotated_coords,circle,nuta]{(0,0,0)}{1}{0}{360}{}{} \tdplotdrawarc[tdplot_rotated_coords,angle,nuta]{(0,0,0)}{\rang}{90-\etheta}{90}{anchor=south west,nuta}{$\theta$} \tdplotdrawarc[tdplot_rotated_coords,angle,nuta]{(0,0,0)}{\rang}{-\etheta}{0}{anchor=south,nuta}{$\theta$} % Rotation propre \tdplotsetrotatedcoords{\epsi}{\etheta}{\ephi} \draw[tdplot_rotated_coords,base,rotp] (O) --(1,0,0) node[anchor=north]{$\overrightarrow{x}_1$}; \draw[tdplot_rotated_coords,base,rotp] (O) --(0,1,0) node[anchor=west]{$\overrightarrow{y}_1$}; \tdplotdrawarc[tdplot_rotated_coords,circle,rotp]{(0,0,0)}{1}{0}{360}{}{} \tdplotdrawarc[tdplot_rotated_coords,angle,rotp]{(0,0,0)}{\rang}{90-\ephi}{90}{anchor=west,rotp}{$\varphi$} \tdplotdrawarc[tdplot_rotated_coords,angle,rotp]{(0,0,0)}{\rang}{-\ephi}{0}{anchor=north,rotp}{$\varphi$} \end{tikzpicture} \end{document} |
Animation des rotations
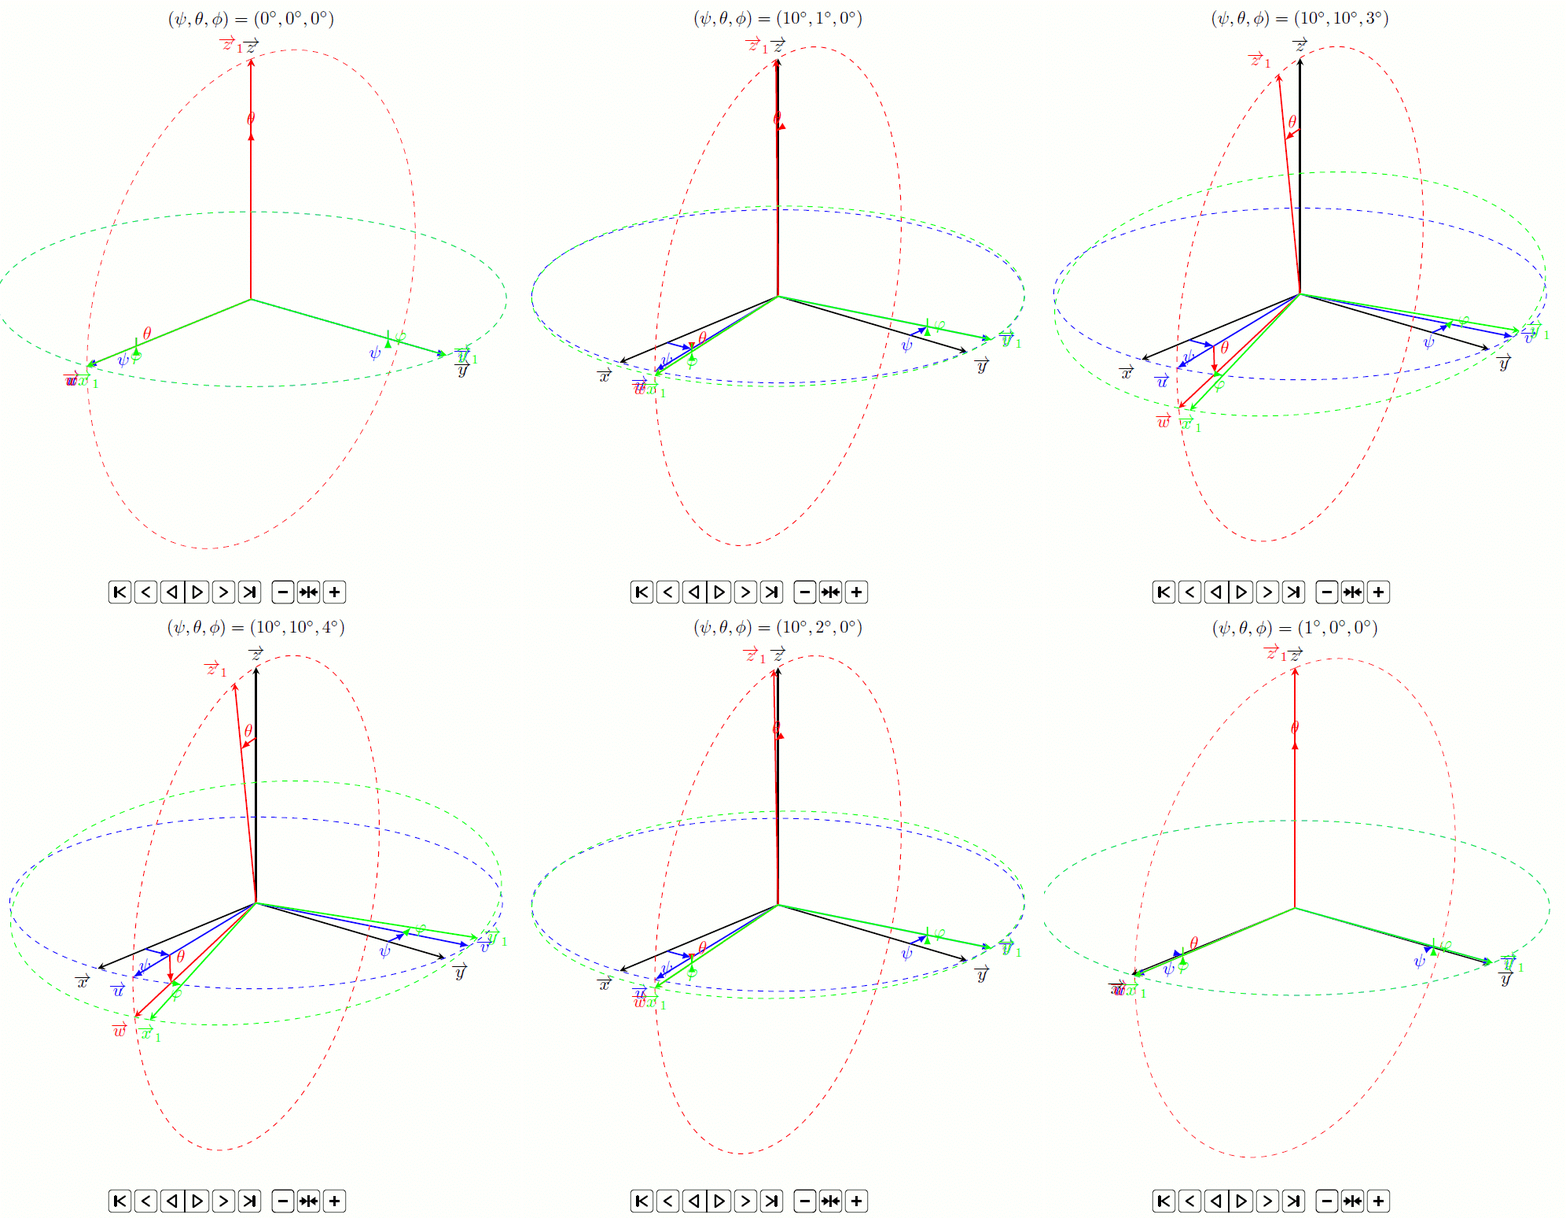
Fort de cette réussite, je me suis dit qu’il était possible de faire un truc encore plus visuel grâce à une animation (par exemple pour une présentation Beamer) :
On utilise pour ce faire le package animate, que j’avais présenté dans un précédent billet. Pour pouvoir faire varier d’abord un angle, puis le second et enfin le troisième, le plus simple est d’utiliser des boucles if.
Code associé :
\usepackage{tikz} \usepackage{tikz-3dplot} \usepackage{animate} \usepackage{ifthen} \usepackage{siunitx} \begin{document} \begin{animateinline}[autoplay,palindrome,controls]{10} \multiframe{30}{iCumAng=0+1}{ \ifthenelse{\iCumAng<10}{ \pgfmathsetmacro{\epsi}{\iCumAng} \pgfmathsetmacro{\etheta}{0} \pgfmathsetmacro{\ephi}{0} }{ \pgfmathsetmacro{\epsi}{10} \ifthenelse{\iCumAng<20}{ \pgfmathsetmacro{\etheta}{\iCumAng-10} \pgfmathsetmacro{\ephi}{0} }{ \pgfmathsetmacro{\etheta}{10} \pgfmathsetmacro{\ephi}{\iCumAng-20} } } \tdplotsetmaincoords{70}{130} \begin{tikzpicture}[tdplot_main_coords,scale=5] %% Définition des différents styles \tikzstyle{init} = [black] % base initiale \tikzstyle{prec} = [blue] % 1ere base intermédiaire \tikzstyle{nuta} = [red] % 2eme base initiale \tikzstyle{rotp} = [green] % base finale \tikzstyle{base} = [thick,-stealth] % Tracé des bases \tikzstyle{angle} = [thick,-latex] % Tracé des arcs pour les angles \tikzstyle{circle} = [thin,dashed] % Tracé des cercles \def\rang{0.7} % Rayon utilisé pour tracer les angles %% Tracé % Repère initial \coordinate (O) at (0,0,0); \draw[base,init] (O) -- (1,0,0) node[anchor=north east]{$\overrightarrow{x}$}; \draw[base,init] (O) -- (0,1,0) node[anchor=north west]{$\overrightarrow{y}$}; \draw[base,init] (O) -- (0,0,1) node[anchor=south]{$\overrightarrow{z}$}; % Précession \tdplotsetrotatedcoords{\epsi}{0}{0} \draw[tdplot_rotated_coords,angle,prec] (O) --(1,0,0) node[anchor=north east]{$\overrightarrow{u}$}; \draw[tdplot_rotated_coords,angle,prec] (O) --(0,1,0) node[anchor=west]{$\overrightarrow{v}$}; \tdplotdrawarc[tdplot_rotated_coords,circle,prec]{(0,0,0)}{1}{0}{360}{}{} \tdplotdrawarc[tdplot_rotated_coords,angle,prec]{(0,0,0)}{\rang}{90-\epsi}{90}{anchor=north east,prec}{$\psi$} \tdplotdrawarc[tdplot_rotated_coords,angle,prec]{(0,0,0)}{\rang}{-\epsi}{0}{anchor=north east,prec}{$\psi$} % Nutation \tdplotsetrotatedcoords{\epsi}{\etheta}{0} \draw[tdplot_rotated_coords,base,nuta] (O) --(1,0,0) node[anchor=north east]{$\overrightarrow{w}$}; \draw[tdplot_rotated_coords,base,nuta] (O) --(0,0,1) node[anchor=south east]{$\overrightarrow{z}_1$}; \tdplotsetrotatedthetaplanecoords{0} \tdplotdrawarc[tdplot_rotated_coords,circle,nuta]{(0,0,0)}{1}{0}{360}{}{} \tdplotdrawarc[tdplot_rotated_coords,angle,nuta]{(0,0,0)}{\rang}{90-\etheta}{90}{anchor=south west,nuta}{$\theta$} \tdplotdrawarc[tdplot_rotated_coords,angle,nuta]{(0,0,0)}{\rang}{-\etheta}{0}{anchor=south,nuta}{$\theta$} % Rotation propre \tdplotsetrotatedcoords{\epsi}{\etheta}{\ephi} \draw[tdplot_rotated_coords,base,rotp] (O) --(1,0,0) node[anchor=north]{$\overrightarrow{x}_1$}; \draw[tdplot_rotated_coords,base,rotp] (O) --(0,1,0) node[anchor=west]{$\overrightarrow{y}_1$}; \tdplotdrawarc[tdplot_rotated_coords,circle,rotp]{(0,0,0)}{1}{0}{360}{}{} \tdplotdrawarc[tdplot_rotated_coords,angle,rotp]{(0,0,0)}{\rang}{90-\ephi}{90}{anchor=west,rotp}{$\varphi$} \tdplotdrawarc[tdplot_rotated_coords,angle,rotp]{(0,0,0)}{\rang}{-\ephi}{0}{anchor=north,rotp}{$\varphi$} \node[anchor=south] at (0,0,1.1) {$(\psi,\theta,\phi)=(\ang{\epsi},\ang{\etheta},\ang{\ephi})$}; \end{tikzpicture} } \end{animateinline} \end{document} |

